


Infographics have long been part of marketing strategies because they grab attention and make information easier to digest. This approach is still highly relevant today, especially for link building. Infographic link building is a practical way to earn attention, attract coverage, and win safe, editorial backlinks without scaling a full outreach team.
In this guide, you’ll learn what infographic link building means, why visual assets perform well, how to plan topics that people share, and the step-by-step process to design, publish, and promote a piece that earns links again and again.


🖼️ Infographic Link Building: What Is It?
Infographic link building is the process of creating a data-rich visual, publishing it on your site with a brief article, and distributing it so reporters, bloggers, and resource pages discover and cite it. When they embed your graphic or reference your findings, they link back to the source. Done well, infographic link building compounds over time because the asset keeps attracting attention from new audiences as it gets reshared. Along the way, you also gain referral traffic, mentions, and branded search interest.
Hosts usually credit visuals with a source link under the image or within the text. These attributions are what we call these links, and they’re typically surrounded by descriptive context, which makes them natural and safe for long-term SEO value.
💡 Reasons to Use Infographics for Link Building
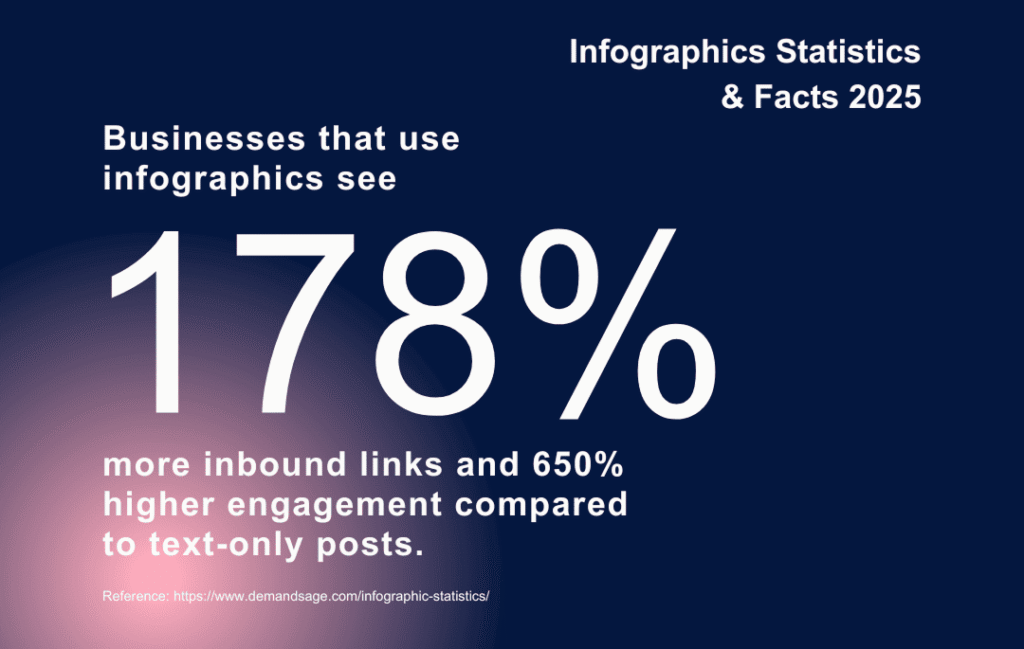
People share images faster than text. That alone gives infographic link building a clear advantage. Visuals compress complex ideas into a quick read; they carry a built-in “save and share” habit; and they create a point of reference other sites can cite. In outreach, an editor can scan a graphic in seconds, decide whether it serves their readers, and move forward without a long editorial cycle.
There’s also format flexibility. An infographic can summarize a report, compare tools, show a process, or map regional data. That means you can match the asset to your pitch angle. Another benefit: you can slice the same design into carousels, shorts, and email embeds, keeping your brand consistent across channels while earning more infographic links from each distribution wave.
🚀 The Advantages of Infographic Link Building
Beyond just breaking up a wall of text, this approach also brings several practical benefits you can rely on:
- Fast comprehension: a well-structured layout makes the message obvious at a glance.
- Higher embed potential: writers love ready-to-use visuals, which leads to more infographic links per pitch.
- Evergreen refreshes: you can update numbers, swap a chart, and relaunch the asset each year.
- Cross-channel leverage: the same visual feeds PR, social, email, and partner updates.
On top of that, design assets raise perceived authority. A strong visual identity and clear sourcing signal care and reliability, which improves your response rate during outreach.
🤔 Is It Hard to Build Links with Infographics?
Infographic link building takes planning, but the steps are manageable. The most common hurdles are thin data, vague topics, heavy files that load slowly, and outreach lists that don’t match the subject. Solve those by validating the idea first, sourcing reputable data, exporting web-friendly files, and pitching outlets that have already covered your theme.
If you’d prefer help, at NeedMyLink, we can run the process of link building for you, and we have different link placement options that fit various budgets and timelines.
🗂️ Types of Infographics
Infographics SEO strategy has over 10 types of infographics to choose from. Select the format that fits your angle and audience best. We’ve organized them in a table for quick reference.
| Type | When to use it | Link-earning angle |
| Statistical / Data | You have proprietary or aggregated numbers worth citing. | Journalists need quotable figures and charts; links flow from citations. |
| Process / How-To | You want to teach a workflow or standard operating procedure. | Solves a problem; gets added to resource pages and tutorials. |
| Comparison / Versus | You’re weighing tools, frameworks, or methods. | High bookmark value during evaluation; attracts roundups. |
| Timeline / History | You want to show how a topic evolved. | Education sites and newsrooms love “history of” assets. |
| Map / Geographic | You have regional or state-level data. | Local media pickup; regional links across multiple markets. |
| Checklist / Cheat Sheet | You aim to provide a ready reference. | High utility; bloggers embed to simplify their own posts. |
| Flowchart / Decision Tree | You want to guide choices with branches. | “Interactive feel” in a static asset; sticky and shareable. |
| Anatomy / Explainer | You’re breaking down a complex object or idea. | Clarity drives citations from explainers and glossaries. |
| Hierarchy / Organization | You’re illustrating structures and models. | Great for education and internal documentation embeds. |
| List / Best Practices | You’re curating steps, ideas, or tips. | Easy to excerpt; earns links from newsletters and blogs. |
| Survey Results | You’ve run a poll with publishable insights. | Fresh findings get press coverage and academic citations. |
| Benchmarks / Indices | You can compare performance across cohorts. | Industry analysts link to tracking pages and updates. |
| Mixed-Media / Poster | You want a flagship visual for brand awareness. | Broad sharing across social media gives steady, passive links. |
By matching the type to your audience’s needs, you increase the odds of your piece being cited, shared, and linked to. Use this table as a quick guide when planning your next visual, and you’ll set yourself up for content that informs and earns lasting backlinks.
🧲 How to Make Link-Attracting Infographics?
With time, it gets repetitive: choose a linkable topic, research trustworthy sources, outline a concise story, design with a clear hierarchy, publish on a fast page, and promote with targeted outreach. Treat the publishing URL as the “source of truth,” and set up tracking before launch so you can measure every embed and unlinked mention.
Before launch, set up a simple tracking sheet with three buckets: earned links, unlinked mentions, and syndications. Use a crawler or alerts to find pages that mention your brand and the title of the visual, then check whether they credited you. For unlinked mentions, prepare a short outreach template that politely asks for attribution and includes the canonical URL. Over a quarter, this habit can recover dozens of credits that would otherwise slip by.
Also, don’t forget to plan for maintenance – visuals age as data changes. Put a reminder in your calendar to review the asset every 6–12 months. If numbers have moved, update the dataset, tweak the charts, and refresh the publish date. Add a brief note at the top of the article that states when it was last updated. That transparency helps readers trust the resource and gives editors a reason to link to the freshest version.
🎯 Choosing an Interesting Topic
Topic selection decides the outcome’s success with infographic link building. Answer these three questions before design:
- Will editors see a clear takeaway in under eight seconds?
- Can you back every claim with a public source or your own dataset?
- Does the angle fit at least 50–100 sites you can pitch? If yes, you have the seed for infographic link building that scales.
Look for questions your audience already asks, fresh data you can visualize, or gaps in popular posts where a graphic would help readers. Favor themes with recurring interest (annual trends, costs by region, process checklists) so you can refresh and relaunch later.
👥 Understanding the Audience Before Designing
Great visuals help the reader to get the job done. Clarify who you’re building for, what decision they’re trying to make, and where they will likely discover the asset. A buyer in procurement wants a cost comparison; a teacher wants a printable handout; a reporter wants a chart with a headline number. Write these expectations next to your outline. They’ll guide the length, tone, and the level of detail.
Also, define distribution channels early. If LinkedIn is the primary path, plan a tall aspect ratio that slices neatly into carousels. If journalists are your target, make room for a bold headline stat in the first panel so they can quote it.
🔎 Conduct In-Depth Research
Infographic link building depends on trust. Build a source of record that lists where each number comes from, links to the original datasets, and dates everything. Prefer primary data (surveys, experiments, logs) when you have it. When you borrow from secondary sources, cross-check two or three references and avoid cherry-picking.
As you gather material, draft the captions that will appear under each chart. That forces clarity and prevents crowded panels later. Keep URLs handy; you’ll add them to a reference list under the published graphic, which further increases the chance of accurate infographic links.
🎨 Less Text, More Visual Impact
If a sentence can become a chart, turn it into a chart. Limit each panel to one idea, one chart type, and a short caption. Use whitespace generously and scale numbers so trends pop without squinting. Readers should be able to “read” the story with images first and use text as support.
Accessibility matters too: include alt text for the image, ensure contrast meets WCAG guidance, and keep decorative elements subtle so they don’t compete with data.
✍️ Designing the Infographic
Start with a grid, then set a type pairing that stays legible on mobile. Pick a color palette with enough contrast between series, and label lines and bars directly where possible, so readers don’t hunt for legends. Favor familiar chart types unless you have a strong reason to try something novel.
Export at 2× for crispness on high-density displays. For on-page wins, treat this as infographic SEO: descriptive file names, alt text, and a caption that repeats the core topic without stuffing. Keep total weight in check so the page loads quickly during peak outreach.
🪞 Adding Final Visual Details
Before publishing, standardize number formats, abbreviations, and units. Align elements to the grid, double-check decimal places, and proofread every label. Add a compact credits area with your brand, year, and data sources. Name the file descriptively (e.g., “state-by-state-solar-adoption-2025.png”) to help image search.
Finally, create an embed code that includes a link back to the source URL with a descriptive anchor. That small detail encourages accurate attribution and more infographic links over time.
✉️ Start Your Outreach Efforts
Prospecting first, then pitching. Build a list of writers and site owners who have covered your topic in the last 6–18 months. Segment by angle (how-to, news, local, academic) and personalize the note with the hook that matches their readers. Keep the email short: one sentence for the finding, one for why it matters, and a link to view the full asset. Offer a ready image file in two sizes, along with the embed code.
Track replies, links, and unlinked mentions. When you spot a fresh mention without attribution, send a friendly note with the source URL. Many editors will add the credit, which turns mentions into infographic links quickly.
Timing matters, too. A simple rhythm that works for many teams is: publish on a Tuesday or Wednesday, send the first wave that morning, follow up on day three, and send a final nudge the following week. Keep the subject line plain (“New data on [topic]”) and avoid superlatives. If you have regional angles, localize your pitch by swapping in the state or city name and leading with the nearby stat. Small tweaks like these raise open rates and replies without extra design work.
Finally, widen your targets beyond media. Niche newsletters, community moderators, university departments, and professional associations often maintain resource pages. When your asset clearly helps their members, they’ll add it and keep it live for years, which turns into steady referral traffic.
⭐ Tips for Infographic Success
Creating the infographic is only half the work. To get the most out of it, follow these practical tips that boost visibility, sharing, and long-term SEO value:
- Add structured data to your page to help search engines parse the asset.
- Include social cards with the headline stat as the image title.
- Refresh annually or quarterly if the topic changes fast, and redirect the old URL if you publish a new version.
- Use UTM parameters on outreach links to measure which channels drive embeds.
- Repurpose the asset into a short video or carousel to reach people who prefer motion or slides.
Small optimizations – like structured data, social cards, and smart repurposing – turn a single infographic into an asset that keeps earning visibility and links over time.
✅ Closing thoughts
Infographic link building works because it pairs human-friendly visuals with clear sourcing and focused outreach. If you treat each project like a small product launch – topic validation, credible data, thoughtful design, fast hosting, and targeted promotion – you’ll build a library of assets that keep earning attention and links. Commit to this system, and infographic link building becomes a dependable growth channel for brand authority, referral traffic, and rankings. And whenever you need support, NeedMyLink is here to help.
⁉️ FAQs About Infographic Link Building
-
Do infographics still work in the age of short-form video?
Yes. Video dominates feeds, but infographics remain the preferred “reference asset.” Journalists, bloggers, and educators need static visuals they can embed, cite, and link to – something video doesn’t offer.
-
How do I stop others from stealing my infographic without credit?
Add a small brand logo and source line at the bottom, create an embed code, and set up alerts to catch unlinked mentions. A polite outreach email usually earns you the missing link.
-
Should I publish the infographic on its own page or inside a blog post?
Do both. Publish it on a dedicated page with optimized file names, alt text, and structured data, but also embed it in a supporting article for context and ranking potential.
-
Do animated infographics perform better for link building than static ones?
Not usually. Animated or interactive versions can boost engagement, but static infographics are easier for most sites to embed, and they’re the ones that earn the backlinks.


